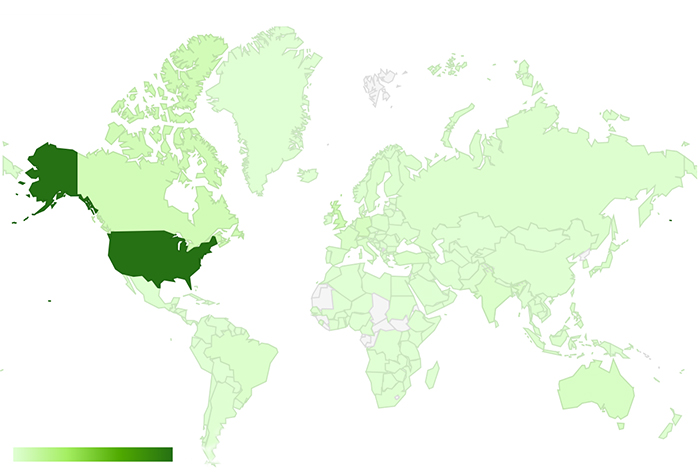
Traffic to Jonesblog was relatively steady year over year from 2011 to 2012, serving up traffic to about 250,000 unique visitors. It picked up a few countries that did not have any visitors from in 2011 like Tajikistan, Turkmenistan and even *Somalia*!!?!?. There were a few countries that did not deliver visitors, but those sub-Saharan African countries not known for the Internet connectivity. Overall though, visitors are steady from almost all parts of the globe brought primarily through Google.
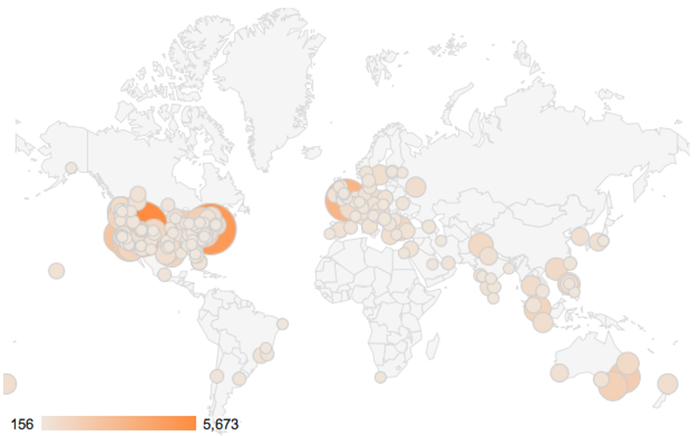
The major cities with people visiting Jonesblog came from Salt Lake city, New York, London, San Francisco Los Angeles, Sydney, Chicago, Toronto, Melbourne, Seattle, Houston, Washington DC, Singapore and Portland. Also coming up in the ranks below that are Istanbul, Denver and Islamabad which outranked Denver interestingly enough. Speaking of international traffic, its been interesting looking at the languages that Jonesblog is being translated into including French, German, Spanish, Portuguese and Russian among others. Google’s Translation service really is amazing.
Looking at how technology is shifting, like the stats for Jonesblog from last year, there were some real surprises. For instance, there was a massive shift away from Microsoft Windows which had 71% of the traffic to Jonesblog in 2011, down to 62% in 2012. Granted, this is only a small sample size, but losing 9% points is substantial in anybodies marketing book. Apple’s OS X picked up a couple of points moving from 19% to 21%, but iOS on phone and tablet moved from 5% to 11.9% from 2011 to 2012. Essentially, these stats show at least for the visitors to Jonesblog, Microsoft lost marketshare to Apple. Android picked up some percentage at 2.09% of the visits and Linux came in at 1.5%. From there, it drops below 1% for any other platform including a slide into seeming irrelevance for Blackberry at 0.18%.
Browser share also changed dramatically with Google’s Chrome going from 23% in 2011 to 31% in 2012. Firefox lost ground, going from 33% to 24% and Safari went from 15% to 22.5%. Internet Explorer continues to lose ground, going from 23% last year to just 16% this year. The rest of the traffic was mobile specific browsers like Android browser and flavors of Opera.
Speaking of mobile, it looks like mobile devices accounted for 14.3% of all visits with Apple iOS devices accounting for over 90% of visits. The Sony Ericsson, Motorola DroidX and Samsung Galaxy Nexus and S each get around 2% of total traffic.
I’ll make posts in future years after the start of the new year looking at how these statistics change. Its always interesting following the statistics as companies change technologies and how they compare to the larger trends in the Internet. Seeing these stats reflect the resurgence of Apple has been simply fascinating. Its also been kinda sad to see the slide for RIM’s Blackberry platform as they simply failed to capitalize on where technology was going.
There were no major changes in how Jonesblog functions or looks this year other than the shift from 600pixel wide images to 700 pixel wide images to better render on higher resolution screens that are becoming available. My friend Duncan went to displaying Retina Display quality images on his website this year, and I expect that when WordPress integrates this functionality into self hosted blogs, I’ll make the shift as well. Of course one of the reasons I went with smaller images in the first place on Jonesblog was to keep people from using the images without permission in print and other sources without fairly compensating me. But it appears that I’ve moved my revenue model more away from stock images towards hired projects and efforts, so perhaps this will be less of an issue going forward. We’ll see…