This abstract was presented today, May 2th at the 2016 Association for Research in Vision and Opthalmology (ARVO) meetings in Seattle, Washington by Michael Kalloniatis, Robert E. Marc, Sieu K. Khuu, Jack Phu, Barbara Zangerl, Lisa Nivison-Smith, myself, and Rebecca L. Pfeiffer.
Abstract Number: 4745
Author Block: Michael Kalloniatis1 , Robert E. Marc3 , Sieu K. Khuu2 , Jack Phu1 , Barbara Zangerl1 , Lisa Nivison-Smith1 , Bryan W. Jones3 , Rebecca L. Pfeiffer3
1 Centre for Eye Health, SOVS, University of New South Wales, Kensington, New South Wales, Australia; 2 SOVS, UNSW, Sydney, New South Wales, Australia; 3 Univ of Utah/Moran Eye Center, Salt Lake City, Utah, United States
Disclosure Block:Michael Kalloniatis, 2014/094035 A1 (USA) and 13865419.9 (EU) (Code P (Patent) ); Robert E. Marc, None; Sieu K. Khuu, 2014/094035 A1 (USA) and 13865419.9 (EU) (Code P (Patent) ); Jack Phu, None; Barbara Zangerl, None; Lisa Nivison-Smith, None; Bryan W. Jones, None; Rebecca L. Pfeiffer, None
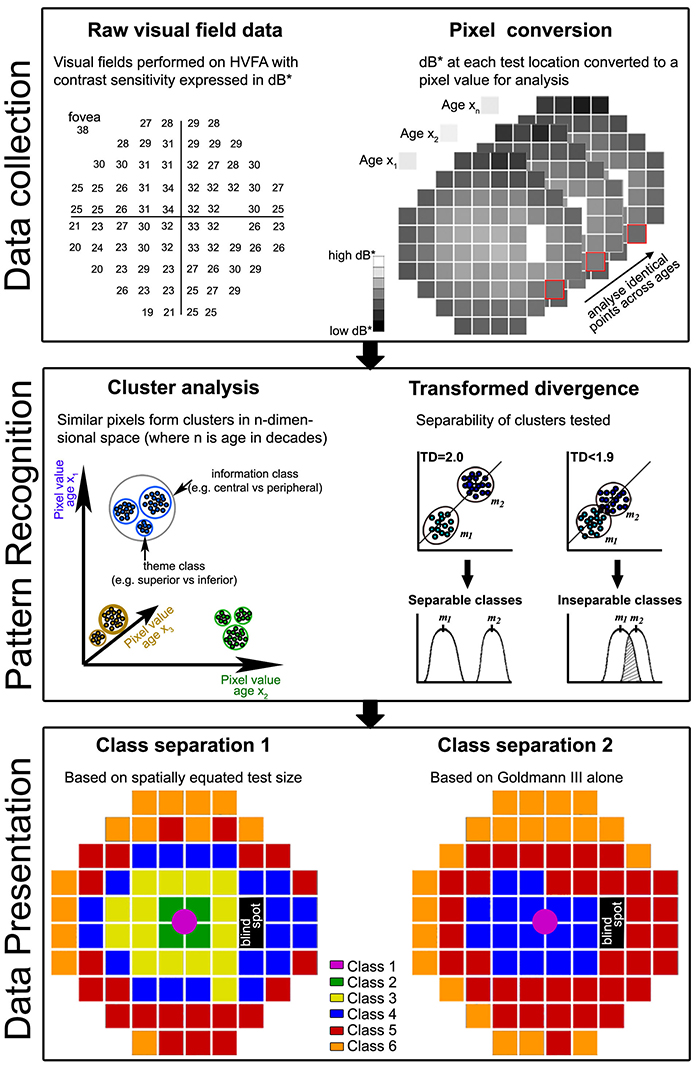
Purpose:To identify areas within the visual field with matching contrast sensitivity (CS) signature patterns as a function of age using pattern recognition and determine the discrimination of CS data when using spatially equated test stimuli compared to the single size Goldmann (G)III alone.
Methods:52 subjects (classified in decade age groups from 20-60+ years) were tested using the Humphrey Visual Field Analyser 30-2 paradigm in full threshold mode for GI to GV. At least two thresholds were obtained per size. Two visual field maps were analyzed: a spatially equated visual field where GI was used centrally, GII mid-peripherally and GIII in the outer rings to place the test size at or close to complete spatial summation and a second where a single GIII was used at all locations. Thresholds were expressed as dB* (Khuu & Kalloniatis, IOVS 2015), converted to pixel values and analyzed using an unsupervised classification using isodata clustering (PCI, Geomatica, Canada). Class separation was extracted across the ages to develop dot plots of decade measures of CS.
Results:The 77 data points across the central 60° visual field can be distilled into 6 functional classes using the spatially equated visual field (Class separation 1). The 6 classes reflect areas in visual space that change in a similar manner across the ages. The use of the single GIII target resulted in only 4 classes displaying a poorer discrimination over the central visual field (Class separation 2). Extracted dot plots from class separation illustrated average CS within each class could be assessed across the decades.
Conclusions:When using spatially equated visual field testing, concentric areas were separated into distinct CS signatures consistent with known visual field sensitivity. We confirmed these areas change systematically with age. GIII failed to discriminate central areas of the 30-2 that likely reflects the fact that this size operates outside complete spatial summation and thus may not be the optimal test size for assessing visual function in the central visual field. More importantly, we showed pattern recognition can be applied to complex visual field data sets to identify common features and age-related visual function changes. This analysis allows regions to be averaged as they are statistically identical: this approach will likely assist structure-function studies.